The colligative properties really depend on the escaping tendency of solvent molecules from the liquid phase. You will recall that the vapor pressure is a direct measure of escaping tendency, so we can use these terms more or less interchangeably.
The tendency of molecules to escape from a liquid phase into the gas phase depends in part on how much of an increase in entropy can be achieved in doing so. Evaporation of solvent molecules from the liquid always leads to a large increase in entropy because of the greater volume occupied by the molecules in the gaseous state. But if the liquid solvent is initially “diluted“ with solute, its entropy is already larger to start with, so the amount by which it can increase on entering the gas phase will be less. There will accordingly be less tendency for the solvent molecules to enter the gas phase, and so the vapor pressure of the solution diminishes as the concentration of solute increases and that of solvent decreases.
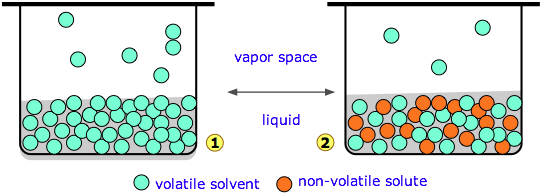
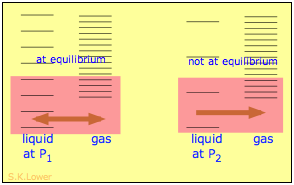
Diagram 1 (above left) represents pure water whose concentration in the liquid is 55.5 M. A tiny fraction of the H2O molecules will escape into the vapor space, and if the top of the container is closed, the pressure of water vapor builds up until equilibrium is achieved. Once this happens, water molecules continue to pass between the liquid and vapor in both directions, but at equal rates, so the partial pressure of H2O in the vapor remains constant at a value known as the vapor pressure of water at the particular temperature.
In the system on the right, we have replaced a fraction of the water molecules with a substance that has zero or negligible vapor pressure — a nonvolatile solute such as salt or sugar. This has the effect of diluting the water, reducing its escaping tendency and thus its vapor pressure.
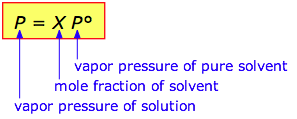
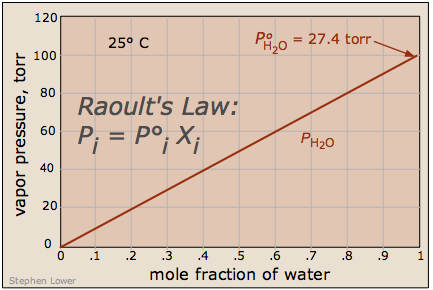 What's important to remember is that the reduction in the vapor pressure of a solution of this kind is directly proportional to the fraction of the [volatile] solute molecules in the liquid — that is, to the mole fraction of the solvent. The reduced vapor pressure is given by Raoult's law (1886):
Since the sum of all mole fractions in a mixture must be unity, it follows that the more moles of solute, the smaller will be the mole fraction of the solvent. Also, if the solute is a salt that dissociates into ions, then the proportion of solvent molecules will be even smaller.
If addition of a nonvolatile solute lowers the vapor pressure of the solution, then it follows that the temperature must be raised to restore the vapor pressure to the value corresponding to the pure solvent. In particular, the temperature at which the vapor pressure is 1 atm will be higher than the normal boiling point by an amount known as the boiling point elevation.
The exact relation between the boiling point of the solution and the mole fraction of the solvent is rather complicated, but for dilute solutions the elevation of the boiling point is directly proportional to the molal concentration of the solute:
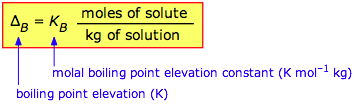
Bear in mind that the proportionality constant KB is a property of the solvent because this is the only component that contributes to the vapor pressure in the model we are considering in this section.
| solvent | normal bp, °C | Kb , K mol–1 kg |
|---|---|---|
| water | 100 | 0.514 |
| ethanol | 79 | 1.19 |
| acetic acid | 118 | 2.93 |
| carbon tetrachloride | 76.5 | 5.03 |
The freezing point of a substance is the temperature at which the solid and liquid forms can coexist indefinitely — that is, they are in equilibrium. Under these conditions molecules pass between the two phases at equal rates because their escaping tendencies from the two phases are identical.
Suppose that a liquid solvent and its solid (water and ice, for example) are in equilibrium (![]() below), and we add a non-volatile solute (such as salt, sugar, or automotive antifreeze liquid) to the water. This will have the effect of reducing the mole fraction of H2O molecules in the liquid phase, and thus reduce the tendency of these molecules to escape from it, not only into the vapor phase (as we saw above), but also into the solid (ice) phase. This will have no effect on the rate at which H2O molecules escape from the ice into the water phase, so the system will no longer be in equilibrium and the ice will begin to melt
below), and we add a non-volatile solute (such as salt, sugar, or automotive antifreeze liquid) to the water. This will have the effect of reducing the mole fraction of H2O molecules in the liquid phase, and thus reduce the tendency of these molecules to escape from it, not only into the vapor phase (as we saw above), but also into the solid (ice) phase. This will have no effect on the rate at which H2O molecules escape from the ice into the water phase, so the system will no longer be in equilibrium and the ice will begin to melt ![]() .
.
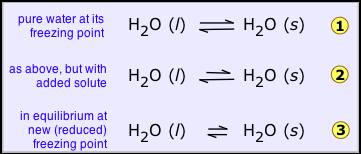
If we wish to keep the solid from melting, the escaping tendency of molecules from the solid must be reduced. This can be accomplished by reducing the temperature; this lowers the escaping tendency of molecules from both phases, but it affects those in the solid more than those in the liquid, so we eventually reach the new, lower freezing point where the two quantities are again in exact balance and both phases can coexist ![]() .
.
If you prefer to think in terms of vapor pressures, you can use the same argument if you bear in mind that the vapor pressures of the solid and liquid must be the same at the freezing point. Dilution of the liquid (the solvent) by the nonvolatile solute reduces the vapor pressure of the solvent according to Raoult’s law, thus reducing the temperature at which the vapor pressures of the liquid and frozen forms of the solution will be equal.
As with boiling point elevation, in dilute solutions there is a simple linear relation between the freezing point depression and the molality of the solute:
| solvent | normal fp , °C | Kf , K mol–1 kg |
|---|---|---|
| water | 0.0 | –1.86 |
| acetic acid | 16.7 | –3.90 |
| benzene | 5.5 | –5.10 |
| camphor | 180 | –40.0 |
| cyclohexane | 6.5 | –20.2 |
| phenol | 40 | –7.3 |
The use of salt to de-ice roads is a common application of this principle. The solution formed when some of the salt dissolves in the moist ice reduces the freezing point of the ice. If the freezing point falls below the ambient temperature, the ice melts. In very cold weather, the ambient temperature may be below the freezing point of the salt solution, and the salt will have no effect.
The effectiveness of a de-icing salt depends on the number of particles it releases on dissociation and on its solubility in water:
| name | formula | lowest practical T, °C |
|---|---|---|
| ammonium sulfate | (NH4)2SO4 | –7 |
| calcium chloride | CaCl2 | –29 |
| potassium chloride | KCl | –15 |
| sodium chloride | NaCl | –9 |
| urea | (NH2)2CO | –7 |
Any ionic species formed by dissociation will also contribute to the freezing point depression. This can serve as a useful means of determining the fraction of a solute that is dissociated.
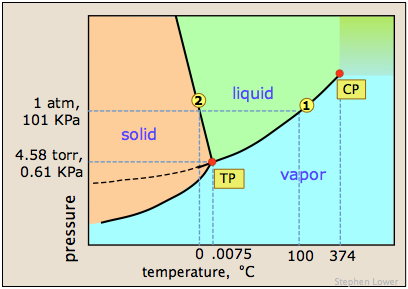
The image shown below expands on this by plotting lines for both pure water and for its "diluted" state produced by the introduction of a non-volatile solute.
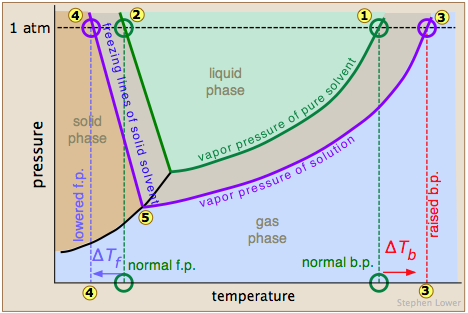
The normal boiling point of the pure solvent is indicated by point  where the vapor pressure curve intersects the 1-atm line — that is, where the escaping tendency of solvent molecules from the liquid is equivalent to 1 atmosphere pressure. Addition of a non-volatile solute reduces the vapor pressures to the values given by the blue line. This shifts the boiling point to the right
  , corresponding to the increase in temperature ΔTb required to raise the escaping tendency of the H2O molecules back up to 1 atm.
To understand freezing point depression, notice that the vapor pressure line intersects the curved black vapor pressure line of the solid (ice) at , which corresponds to a new triple point ![]() at which all three phases (ice, water vapor, and liquid water) are in equilibrium and thus exhibit equal escaping tendencies. This point is by definition the origin of the freezing (solid-liquid) line, which intersects the 1-atm line at a reduced freezing point ΔTf, indicated by
at which all three phases (ice, water vapor, and liquid water) are in equilibrium and thus exhibit equal escaping tendencies. This point is by definition the origin of the freezing (solid-liquid) line, which intersects the 1-atm line at a reduced freezing point ΔTf, indicated by ![]() .
.
Note that the above analysis assumes that the solute is soluble only in the liquid solvent, but does not remain in the frozen solvent. This is generally more or less true. For example, when arctic ice forms from seawater, the salts get mostly "squeezed" out. This has the interesting effect of making the water that remains more saline, and hence more dense, causing it to sink to the bottom part of the ocean where it gets taken up by the south-flowing deep current.
... and yet another take on freezing and boiling
This subsection is best avoided by those who have not studied thermodynamics and Gibbs free energy!
Those readers who have some knowledge of thermodynamics will recognize that what we have been referring to as "escaping" tendency is really a manifestation of the Gibbs free energy. This schematic plot shows how the G's for the solid, liquid, and gas phases of a typical substance vary with the temperature.
The phase that is most stable (and which therefore is the only one that exists) is always the one having the most negative free energy (indicated here by the thicker portions of the plotted lines.) The melting and boiling points correspond to the respective temperatures where the free energies of the solid and liquid , and of the liquid and vapor
  are identical:
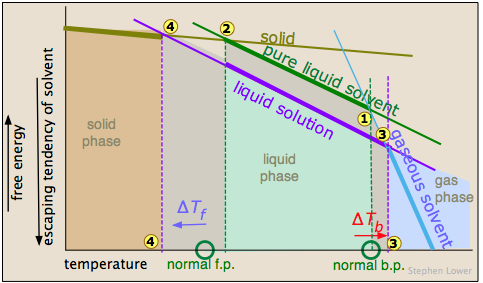
As we saw above, adding a solute to the liquid dilutes it, making its free energy more negative, with the result that the freezing and boiling points are shifted to the left and right, respectively.
All these effects result from “dilution” of the solvent by the added solute, and because of this commonality they are referred to as colligative properties (Lat. co ligare, connected to.) The key role of the solvent concentration is obscured by the greatly-simplified expressions used to calculate the magnitude of these effects, in which only the solute concentration appears. The details of how to carry out these calculations and the many important applications of colligative properties are covered elsewhere. Our purpose here is to offer a more complete explanation of why these phenomena occur.
Basically, these all result from the effect of dilution of the solvent on its entropy, and thus in the increase in the density of energy states of the system in the solution compared to that in the pure liquid. Equilibrium between two phases (liquid-gas for boiling and solid-liquid for freezing) occurs when the energy states in each phase can be populated at equal densities. The temperatures at which this occurs are depicted by the shading.
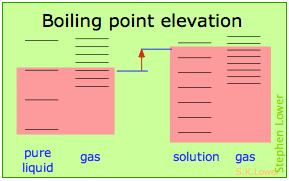
Dilution of the solvent adds new energy states to the liquid, but does not affect the vapor phase. This raises the temperature required to make equal numbers of microstates accessible in the two phases.
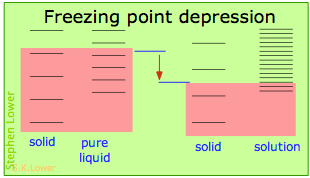 Dilution of the solvent adds new energy states to the liquid, but does not affect the solid phase. This reduces the temperature required to make equal numbers of states accessible in the two phases.
Osmotic pressure arises from the pressure dependence of entropy
When a liquid is subjected to hydrostatic pressure— for example, by an inert, non-dissolving gas that occupies the vapor space above the surface, the vapor pressure of the liquid is raised. The pressure acts to compress the liquid very slightly, effectively narrowing the potential energy well in which the individual molecules reside and thus increasing their tendency to escape from the liquid phase. (Because liquids are not very compressible, the effect is quite small; a 100-atm applied pressure will raise the vapor pressure of water at 25°C by only about 2 torr.) In terms of the entropy, we can say that the applied pressure reduces the dimensions of the "box" within which the principal translational motions of the molecules are confined within the liquid, thus reducing the density of energy states in the liquid phase.
 Applying hydrostatic pressure to a liquid increases the spacing of its microstates, so that the number of energetically accessible states in the gas, although unchanged, is relatively greater— thus increasing the tendency of molecules to escape into the vapor phase. In terms of free energy, the higher pressure raises the free energy of the liquid, but does not affect that of the gas phase.
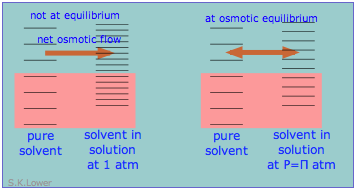
This phenomenon can explain osmotic pressure. Osmotic pressure, students must be reminded, is not what drives osmosis, but is rather the hydrostatic pressure that must be applied to the more concentrated solution (more dilute solvent) in order to stop osmotic flow of solvent into the solution. The effect of this pressure Π is to slightly increase the spacing of solvent energy states on the high-pressure (dilute-solvent) side of the membrane to match that of the pure solvent, restoring osmotic equilibrium.