Phases, changes of state
Vapor pressure, boiling, and phase maps
A given substance will exist in the form of a solid, liquid, or gas, depending on the temperature and pressure. In this unit, we will learn what common factors govern the preferred state of matter under a particular set of conditions, and we will examine the way in which one phase gives way to another when these conditions change.
Water's changes of state contribute to the drama of nature.
Seascape study with rain clouds - John Constable, 1825
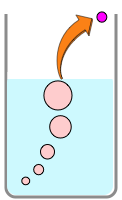
 Earlier in the morning, these droplets were tiny crystals of ice, but even though the air temperature is still around 0°C and will remain so all day, the sun's warmth has rendered them into liquid form, bound up by surface tension into reflective spheres. By late afternoon, most of the drops will be gone, their H2O molecules now dispersed as a tenuous atmospheric gas.
[image: Crawford Wilson III]
Solid, liquid, and gas — these are the basic three states, or phases, in which the majority of small-molecule substances can exist. At most combinations of pressure and temperature, only one of these phases will be favored; this is the phase that is most thermodynamically stable under these conditions.
Origins of stability: why is one phase usually favored?
A full explanation of this would go beyond the scope of what most students who see this lesson are familiar with, but the following greatly over-simplified explanation should convince you that it is something more than black magic:
All atoms and molecules at temperatures above absolute zero possess thermal energy that keeps them in constant states of motion. A fundamental law of nature mandates that this energy tends to spread out and be shared as widely as possible. Within a single molecular unit, this spreading and sharing can occur by dispersing the energy into the many allowed states of motion (translation, vibration, rotation) of the molecules of the substance itself. There are a huge number of such states, and they are quantized, meaning that they all require different amounts of thermal energy to come into action. Temperature is a measure of the intensity of thermal energy, so the higher the temperature, the greater will be the number of states that can be active, and the more extensively will the energy be dispersed among these allowed states.
In solids, the molecular units are bound into fixed locations, so the kinds of motion (and thus the number of states) that can be thermally activated is relatively small. Because the molecules of solids possess the lowest potential energies, solids are the most stable states at low temperatures. At the other extreme are gas molecules which are not only free to vibrate and rotate, but are in constant translational motion. The corresponding number of quantum states is hugely greater for gases, providing a nearly-endless opportunity to spread energy. But this can only happen if the temperature is high enough to populate this new multitude of states. Once it does, the gaseous state wins out by a landslide.
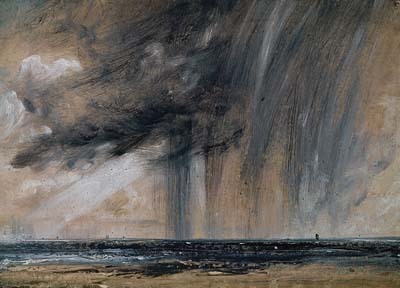
Escaping tendency of a substance from a phase
 In much the same way that tea spreads out from a tea bag into the larger space of the water in which it is immersed, molecules that are confined within a phase (liquid, solid, or gas) will tend to spread themselves (and the thermal energy they carry with them) as widely as possible. This fundamental law of nature is manifested in what we will call the escaping tendency of the molecules from the phase. The escaping tendency is a quantity of fundamental importance in understanding all chemical equilibria and transformations. We need not define the term in a formal way at this point. What is important for now is how we can observe and compare escaping tendencies.
Think first of a gas: what property of the gas constitutes the best measure of its tendency to escape from a container? It does not require much reflection to conclude that the greater the pressure of the gas, the more frequently will its molecules collide with the walls of the container and possibly find their way through an opening to the outside. Thus the pressure confining a gas is a direct measure of the tendency of molecules to escape from a gaseous phase.
What about liquids and solids? Although we think of the molecules of condensed phases as permanently confined within them, these molecules still possess some thermal energy, and there is always a chance that one that is near the surface will occasionally fly loose and escape into the space outside the solid or liquid.
Vapor pressure
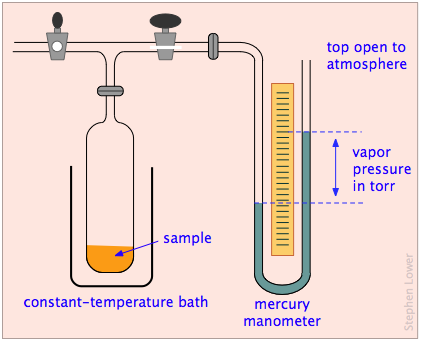
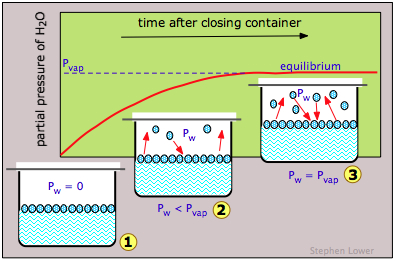
We can observe the tendency of molecules to escape into the gas phase from a solid or liquid by placing the substance in a closed, evacuated container connected to a manometer for measuring gas pressure.
Vapor pressure plots and boiling points
The escaping tendency of molecules from a phase always increases with the temperature; therefore the vapor pressure of a liquid or solid will be greater at higher temperatures. As the figure shows, the variation of the vapor pressure with the temperature is not linear.
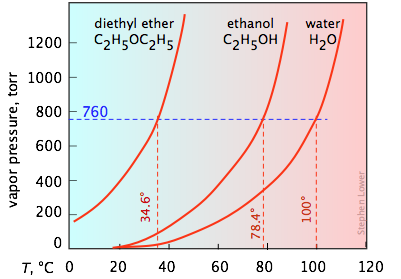 It's important that you be able to interpret vapor pressure plots such as the three shown here. Take special note of how boiling points can be found from these plots. You will recall that the normal boiling point is the temperature at which the liquid is in equilibrium with its vapor at a partial pressure of 1 atm (760 torr). Thus the intercepts of each curve with the blue dashed 760-torr line indicate the normal boiling points of each liquid. Similarly, you can easily estimate the boiling points these liquids would have in Denver, Colorado where the atmospheric pressure is 630 torr by simply constructing a horizontal line corresponding to this pressure.
- The normal boiling point is the temperature at which the vapor pressure is the same as that of the standard atmosphere, 760 torr.
- The boiling point at any other pressure can be found by dropping a vertical line from the curve to the temperature axis.
- As seen on the inset plot, the vapor pressure curve of water ends at the critical point.
Relative humidity
The vapor pressure of water at 22°C is about 20 torr, or around 0.026 atm (2.7 KPa). This is the partial pressure of H2O that will be found in the vapor space within a closed container of water at this temperature; the air in this space is said to be saturated with water vapor.
In ordinary air, the partial pressure of water vapor is normally less than its saturation or equilibrium value. The ratio of the partial pressure of H2O in the air to its (equilibrium) vapor pressure at any given temperature is known as the relative humidity. Water enters the atmosphere through evaporation from the ocean and other bodies of water, and from water-saturated soils. The resulting vapor tends to get dissipated and diluted by atmospheric circulation, so the relative humidity rarely reaches 100 percent. When it does and the weather is warm, we are very uncomfortable because vaporization of water from the skin is inhibited; if the air is already saturated with water, then there is no place for our perspiration to go, other than to drip down our face.
Why the indoor air is so dry in the winter
Because the vapor pressure increases with temperature, a parcel of air containing a fixed partial pressure of water vapor will have a larger relative humidity at low temperatures than at high temperatures. Thus when cold air enters a heated house, its water content remains unchanged but the relative humidity drops. In climates with cold winters, this promotes increased moisture loss from house plants and from mucous membranes, leading to wilting of the former and irritation of the latter.
What is the dew point?
 In the evening, especially on clear nights, solid objects (even spider webs!) lose heat to the sky more rapidly than does the air. It is often important to know what temperature such objects must drop to so that atmospheric moisture will condense out on them.
The dew point is the temperature at which the relative humidity is 100 percent — that is, the temperature at which the vapor pressure of water becomes equal to its partial pressure at a given [higher] temperature and relative humidity. [image]
For water to condense directly out of the atmosphere as rain, the air must be at or below the dew point, but this is not of itself the only requirement for the formation of rain, as we will see shortly.
Vapor pressures of solid hydrates
Many solid salts incorporate water molecules into their crystal lattices; the resulting compounds are known as hydrates. These solid hydrates possess definite vapor pressures which correspond to equilibrium between the hydrated and anhydrous compounds and water vapor. For example:
SrCl2·6H2O(s) → SrCl2(s) +6H2O(g)
The vapor pressure of this hydrate is 8.4 torr at 25°C. Only at this unique partial pressure of water vapor can the two solids coexist at 25°C. If the partial pressure of water in the air is greater than 8.4 torr, a sample of anhydrous SrCl2 will absorb moisture from the air and change into the hydrate.
If the partial pressure of H2O in the air is less than the vapor pressure of the hydrate, the latter will tend to lose moisture and revert back to its anhydrous form. This process is sometimes accompanied by a breakup of the crystal into a powdery form, an effect known as efflorescence.
Evaporation and boiling of a liquid, and condensation of a gas (vapor) are such ordinary parts of our daily life that we hardly give them a thought. Every time we boil water to make a pot of tea and see the cloud of steam above the teapot, we are observing this most common of all phase changes. How can we understand these changes in terms of vapor pressure?
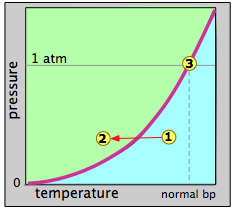
Suppose that we select an arbitrary point 1 at a temperature and pressure at which only the gaseous state is stable. We then decrease the temperature so as to move the state point toward point 2 in the liquid region. When the state point falls on the vapor pressure line, the two phases can coexist and we would expect some liquid to condense. Once the state point moves to the left of the vapor pressure line, the substance will be entirely in the liquid phase. This is supposedly what happens when "steam" (actually tiny water drops) forms above a pot of boiling water.
The reverse process should work the same way: starting with a temperature in the liquid region, nothing happens until we reach the vapor pressure line, at which point the liquid begins to change into vapor. At higher temperatures, only the vapor remains.
Bubbles and drops
The reason for the discrepancy is that the vapor pressure, as we normally use the term and as it is depicted by the liquid-vapor line on the phase diagram, refers to the partial pressure of vapor in equilibrium with a liquid whose surface is reasonably flat, as it would be in a partially filled container. In a drop of liquid or in a bubble of vapor within a liquid, the surface of the liquid is not flat, but curved. For drops or bubbles that are of reasonable size, this does not make much difference, but these drops and bubbles must grow from smaller ones, and these from tinier ones still. Eventually, one gets down to the primordial drops and bubbles having only a few molecular dimensions, and it is here that we run into a problem: this is the problem of nucleation — the formation and growth of the first tiny drop (in the vapor) or of a bubble (in a liquid).
The nucleation problem
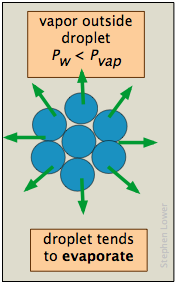
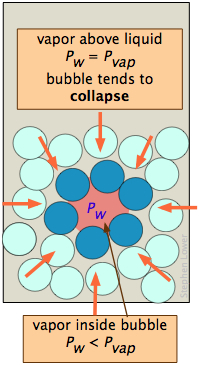
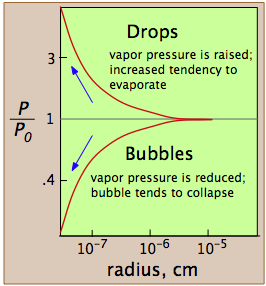
These plots show how, in the case of water, the vapor pressure of a very small bubble or drop varies with its radius of curvature; the quantity being plotted is the ratio of the actual vapor pressure P to Po, the vapor pressure of a flat surface.
Condensation of a liquid
If the tiniest of drops are destined to self-destruct, why do vapors ever condense, and why does it rain?
- If you cool a vapor in a container, condensation takes place not within the vapor itself, but on the inner surface of the container. What happens here is that intermolecular attractions between the solid surface will cause vapor molecules to adsorb to the surface and stabilize the incipient drop until it grows to a size at which it can be self-sustaining. This is the origin of the condensation on the outside of a cool drink, or of the dew that appears on the grass.
- In the case of the cloud of steam you see over the boiling water, the first few droplets form on tiny dust particles in the air — the ones you can see by scattered light when a sunbeam shines through a darkened room.
This Wikipedia article describes how cloud condensation nuclei form. The conditions under which cloud droplets coalesce into rain is not thoroughly understood. For a readable overview, see here.
 Clouds and precipitation In the region of the atmosphere where rain forms there are large numbers of solid particles, mostly of microscopic size. Some of these are particles of salt produced by evaporation of spray from the ocean surface. Many condensation nuclei are of biological origin; these include bacteria, spores, and particles of ammonium sulfate. There is volcanic and meteor dust, and of course there is dust and smoke due to the activities of humans. These particles tend to adsorb water vapor, and some may even dissolve to form a droplet of concentrated solution. In either case, the vapor pressure of the water is reduced below its equilibrium value, thus stabilizing the aggregate until it can grow to self-sustaining size and become fog, rain, or snow.
Superheating and boiling of liquids
 What is the difference between the evaporation and boiling of a liquid? When a liquid evaporates at a temperature below its boiling point, the molecules that enter the vapor phase do so directly from the surface. When a liquid boils, bubbles of vapor form in the interior of the liquid, and are propelled to the surface by their lower density (buoyancy). As they rise, the diminishing hydrostatic pressure causes the bubbles to expand, reducing their density (and increasing their buoyancy) even more.
But as we explained above, getting that first bubble to form and survive is often sufficiently difficult that liquids commonly superheat before the begin to boil.
In large quantities, superheated liquids can be very dangerous, because the introduction of an impurity (such as release of an air bubble from the container surface) or even a mechanical disturbance can trigger nucleation and cause boiling to occur suddenly and almost explosively.
Exploding water in the microwave
Many people have been seriously burned after attempting to boil water in a microwave oven, or after having added powdered material such as instant coffee to such water. When water is heated on a stove, the bottom of the container superheats only the thin layer of water immediately in contact with it, producing localized "microexplosions" that you can hear just before regular smooth boiling begins; these bubbles quickly disperse and serve as nucleation centers for regular boiling.
In a microwave oven, however, the energy is absorbed by the water itself, so that the entire bulk of the water can become superheated. If this happens, the slightest disturbance can produce an explosive flash into vapor.
See here for more and for some suggestions on how to avoid this danger.
Sublimation
Some solids have such high vapor pressures that heating leads to a substantial amount of direct vaporization even before the melting point is reached. This is the case for solid iodine, for example. I2 melts at 115°C and boils at 183°C, is easily sublimed at temperatures around 100°C. Even ice has a measurable vapor pressure near its freezing point, as evidenced by the tendency of snow to evaporate in cold dry weather.
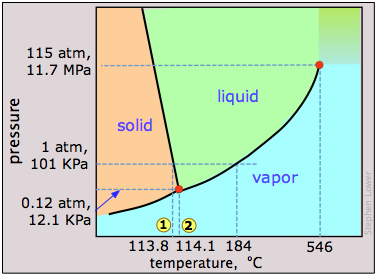
There are other solids whose vapor pressure overtakes that of the liquid before melting can occur. Such substances sublime without melting; a common example is solid carbon dioxide (“Dry Ice”) at 1 atm (see the CO2 phase diagram below).
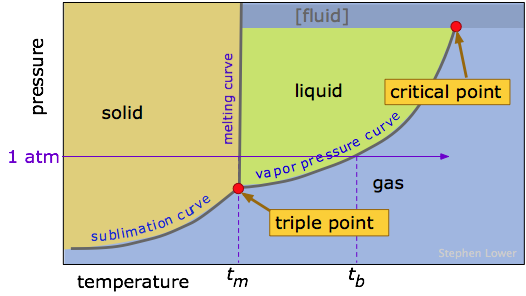
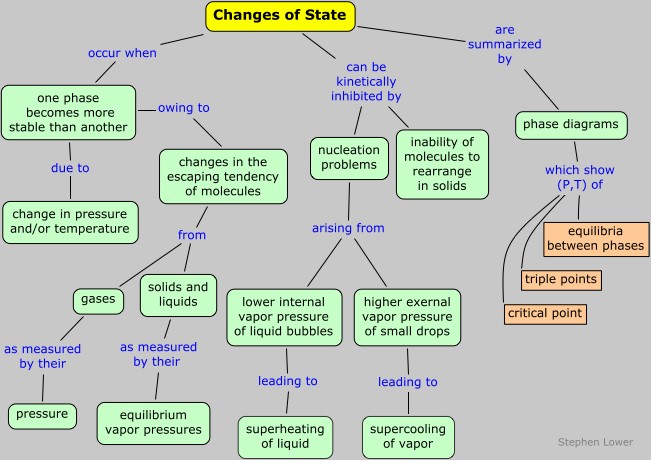
The temperatures and pressures at which a given phase of a substance is stable (that is, from which the molecules have the lowest escaping tendency) is an important property of any substance. Because both the temperature and pressure are factors, it is customary to plot the regions of stability of the various phases in P - T coordinates, as in this generic phase diagram (or phase map) for a hypothetical substance.
It is important that you be able to interpret a phase map, or alternatively, construct a rough one when given the appropriate data. Take special note of the following points:
- The three colored regions on the diagram are the ranges of pressure and temperature at which the corresponding phase is the only stable one.
- The three lines that bound these regions define all values of (P,T) at which two phases can coexist (i.e., be in equilibrium). Notice that one of these lines is the vapor pressure curve of the liquid as described above. The "sublimation curve" is just a vapor pressure curve of the solid. The slope of the line depends on the difference in density of the two phases.
- In order to depict the important features of a phase diagram over the very wide range of pressures and temperatures they encompass, the axes are not usually drawn to scale, and are usually highly distorted. This is the reason that the "melting curve" looks like a straight line in most of these diagrams.
- Where the three named curves intersect, all three phases can coexist. This condition can only occur at a unique value of (P,T ) known as the triple point. Since all three phases are in equilibrium at the triple point, their vapor pressures will be identical at this temperature.
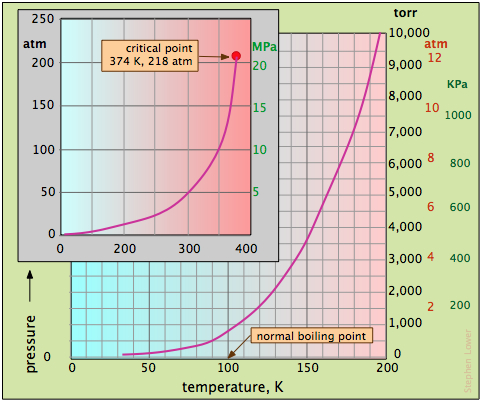
- The line that separates the liquid and vapor regions ends at the critical point. At temperatures and pressures greater than the critical temperature and pressure, no separate liquid phase exists. We refer to this state simply as a fluid, although the term supercritical liquid is also commonly used.
The best way of making sure you understand a phase diagram is to imagine that you are starting at a certain temperature and pressure, and then change just one of these parameters, keeping the other constant. You will be traversing a horizontal or vertical path on the phase map, and there will be a change in state every time your path crosses a line. Of special importance is the horizontal path (shown by the blue line on the diagram above) corresponding to a pressure of 1 atmosphere; this line defines the normal melting and boiling temperatures of a substance.
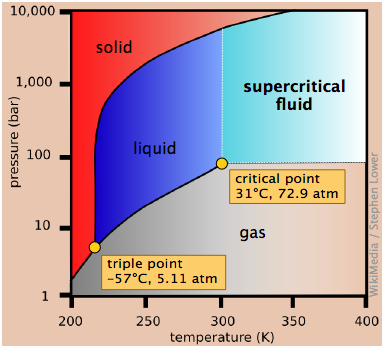
Phase map of Water
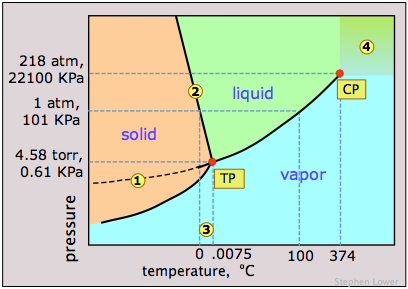
- The slope of the line 2 separating the solid and liquid regions is negative; this reflects the unusual property that the density of the liquid is greater than that of the solid, and it means that the melting point of ice decreases as the pressure increases. Thus if ice at 0°C is subjected to a high pressure, it will find itself above its melting point and it will melt. (Contrary to what is sometimes said, however, this is not the reason that ice melts under the pressure of ice skates or skis, providing a lubricating film which makes these modes of transportation so enjoyable. The melting in these cases arises from frictional heating.)
- The dashed line 1 is the extension of the liquid vapor pressure line below the freezing point. This represents the vapor pressure of supercooled water
— a metastable state of water which can temporarily exist down to about –20°C. (If you live in a region subject to "freezing rain", you will have encountered supercooled water!) - 3 The triple point (TP) of water is just 0.0075° above the freezing point; only at this temperature and pressure can all three phases of water coexist indefinitely.
- 4 Above the critical point (CP) temperature of 374°C, no separate liquid phase of water exists.

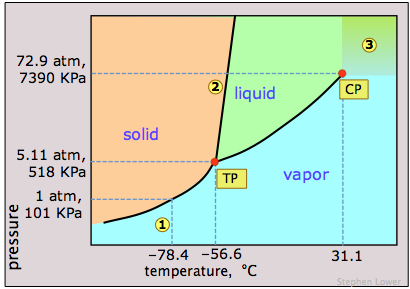
Phase map of Carbon dioxide
Phase diagram of iodine
Elemental iodine, I2, forms dark gray crystals that have an almost metallic appearance. It is often used in chemistry classes as an example of a solid that is easily sublimed; if you have seen such a demonstration or experimented with it in the lab, its phase diagram might be of interest.
The most notable feature of iodine's phase behavior is the very small difference (less than a degree) between the temperatures of its triple point 1 and melting point 2.
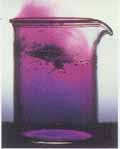 Contrary to the impression many people have, there is nothing really special about iodine's tendency to sublime, which is shared by many molecular crystals including ice and naphthalene ("moth crystals".) The vapor pressure of iodine at room temperature is really quite small — only about 0.3 torr (40 Pa).The fact that solid iodine has a strong odor and is surrounded by a purple vapor in a closed container is mainly a consequence of its strong ability to absorb green light (this leaves blue and red which make purple) and the high sensitivity of our noses to its vapor. [image]
Phase diagram of sulfur
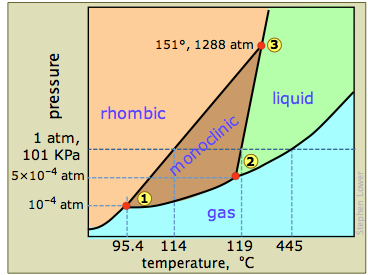
The phase diagram of sulfur contains a new feature: there are two solid phases, rhombic and monoclinic. The names refer to the crystal structures in which the S8 molecules arrange themselves. This gives rise to three triple points, indicated by the numbers on the diagram. [Question: which three phases can never coexist?]
When rhombic sulfur (the stable low-temperature phase) is heated slowly, it changes to the monoclinic form at 114°C, which then melts at 119°. But if the monoclinic form is heated rapidly the molecules do not have time to rearrange themselves, so the rhombic arrangement persists as a metastable phase until it melts at 119-120°.
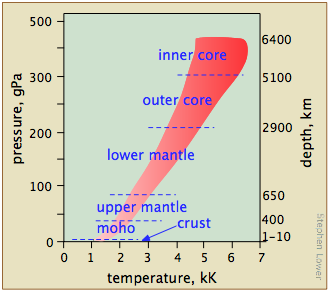
What ranges of temperatures and pressures are likely to be of interest — and more importantly, are experimentally accessible?
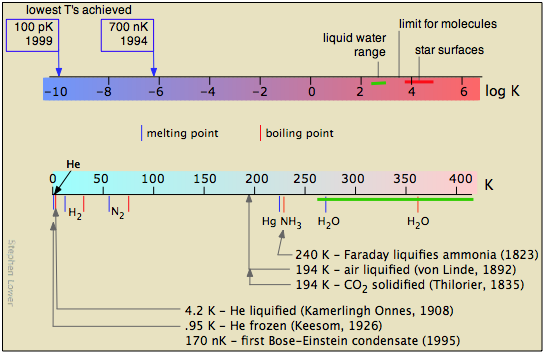
Extreme temperatures
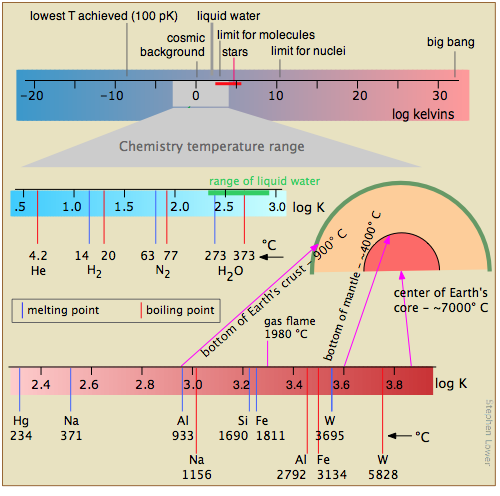
This diagram shows several scales (all of which, please note, are logarithmic) that cover respectively
- the temperature range for the universe;
- the low temperatures of importance to chemistry (note the green line indicating the temperatures at which liquid water can exist);
- the higher temperatures, showing the melting and boiling points of several elements for reference.
The highest temperatures that can be produced in the laboratory are achieved (but only for very short time intervals) by light pulses from laser or synchrotron radiation.
Some references:
- detailed timeline of low-temperature technology
- Carl von Linde (liquifaction of air)
- Heike Kammerlingh Onnes (1913 Nobel Prize in physics)
- Bose-Einstein condensation
Phase studies at high pressures•
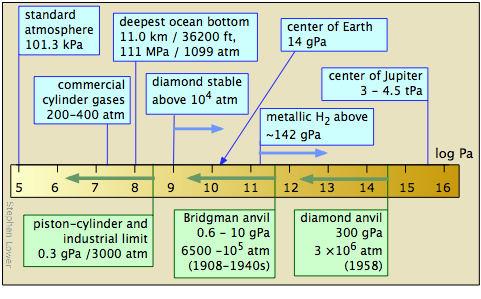
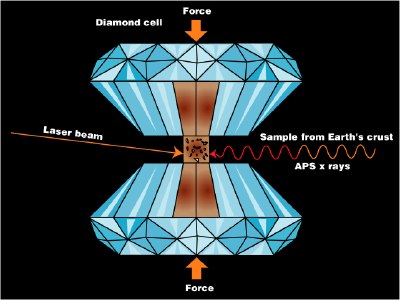
The study of matter at high pressures is not an easy task. The general techniques were pioneered between 1908-1960 by P.W. Bridgman of Harvard University, whose work won him the 1946 Nobel Prize in physics. The more recent development of the diamond anvil cell has greatly extended the range of pressures attainable and the kinds of observations that can be made. Shock-wave techniques have made possible the production of short-lived pressures in the tPa range.
Diamond anvil cell
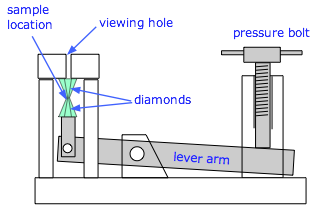
Close-up of the diamond anvil |
A modern diamond-anvil cell (source) |

These studies have revealed that many molecular substances such as hydrogen and water change to solid phases having melting points well above room temperature at very high pressures; there is a solid form of ice that remains frozen even at 100°C. At still higher pressures, many of these substances become metals. It is believed that much of the inner portion of the largest planets consists of metallic hydrogen — and, in fact, that all substances can become metallic at sufficiently high pressures.
Phase diagram of carbon: diamond and graphite
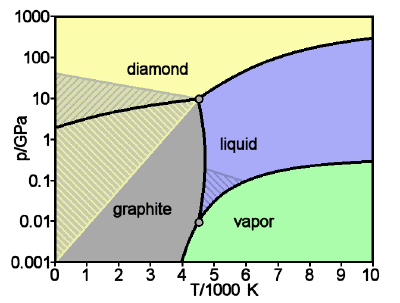 Graphite is the stable form of solid carbon at low pressures; diamond is only stable above about 104 atm. But once it is in this form, the rate at which diamond converts back to graphite is immeasurably slow under ordinary environmental conditions; there is simply not enough thermal energy available to break all of those carbon-carbon bonds. So the diamonds we admire in jewelry and pay dearly for are said to be metastable. [image: WikiMedia]
Synthetic diamonds
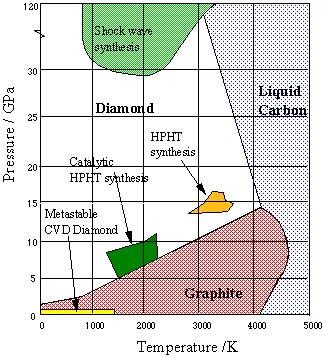
In order to transform graphite into diamond at a reasonable rate, a pressure of 200,000 atm and a temperature of about 4000 K would be required.
Since no apparatus can survive these conditions, the process, known as high pressure high temperature synthesis (HPHT) is carried out commercially at 70,000 atm and 2300 K in a solution of molten nickel, which also acts as a catalyst. Traces of Ni in the finished product serve to distinguish synthetic diamonds from natural ones. But most synthetic diamonds are too small (only a few millimeters) and too flawed for gem quality, and are used mainly to fabricate industrial grinding and cutting tools.
More recently, thin diamond films have become important for engineering applications and semiconductor fabrication. These are most commonly made by condensation of gaseous carbon onto a suitable substrate (chemical vapor deposition, CVD). The conditions under which synthetic diamonds are made are depicted on the above phase diagram from Bristol University [link].
Helium phase weirdness
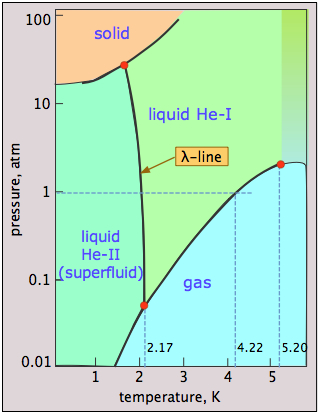
- helium can be frozen only at high pressures;
- the solid and gas cannot coexist (be in equilibrium) under any conditions;
- there are two liquid phases, helium I (an ordinary liquid) and helium II (a highly unusual ordered liquid); the λ (lambda) line represents the (P,T) values at which the two phases can coexist.
- helium-II behaves as a superfluid — essentially a quantum liquid.
Why can't liquid helium freeze at low pressures? The low mass of the He atoms and their close confinement in the solid provides them with a very high zero-point energy (the Heisenberg uncertainty principle in action!) that allows them to vibrate with such amplitude that they overcome the dispersion forces that would otherwise hold the solid together, thus keeping the atoms too separated to form a solid. Only by applying a high pressure (25 atm) can this effect be overcome.
Helium-II, quantum liquids and superfluidity
We usually need quantum theory only to describe the properties of tiny objects such as electrons, but with liquid He-II, quantum effects extend to the macroscopic scale of the bulk liquid. He4 atoms (99.99+ percent of natural helium) are bosons, which means that at low temperatures, they can all occupy the same quantum state. (All other normal atoms are fermions and are subject to the Pauli exclusion principle.)
All together, now
Objects that occupy the same quantum state all possess the same momentum. Thus when one atom moves, they all move together. In a sense, this means that the entire bulk of liquid He-II acts as a single entity. This property, known as superfluidity, gives rise to a number of remarkable effects, most notably:
- The liquid can flow through a narrow channel without friction, up to a critical velocity that depends on the ratio of flow rate to channel width;
- When placed in a container, they form a film that climbs up the walls and down the outside, seeking the same level outside the container as inside if this is possible;
- A small molecule dissolved in helium-II behaves the same as it would in a vacuum. [PhysicsWorld article].
In liquid helium-II, only about 10% of the atoms are in such a state, but it is enough to give the liquid some of the weird properties of a quantum liquid.
He3 exhibits similar properties, but owing to its low natural abundance, it was not extensively studied until the 1940s when large amounts became available as a byproduct of nuclear weapons manufacture. Finally, in 1996, its superfluidity was observed at a temperature of 2 nK. Although He3 atoms are fermions, only those that pair up (and thus assume the properties of bosons) give rise to superfluidity.
For more on superfluidity, see this U. of Alaska site, this Wikipedia article, this Scientific American site (with video)
Another interesting video: here
Water at high pressures
Water, like most other substances, exhibits many solid forms at higher pressures. So far, fifteen distinct ice phases have been identified; these are designated by Roman numerals ice-I through ice-XV. Ice-I can exist in two modifications; the crystal lattice of ice-Ic is cubic, while that of ice-Ih is hexagonal. The latter corresponds to the ordinary ice that we all know. It's interesting to note that several high-pressure phases of ice can exist at temperatures in excess of 100°C.
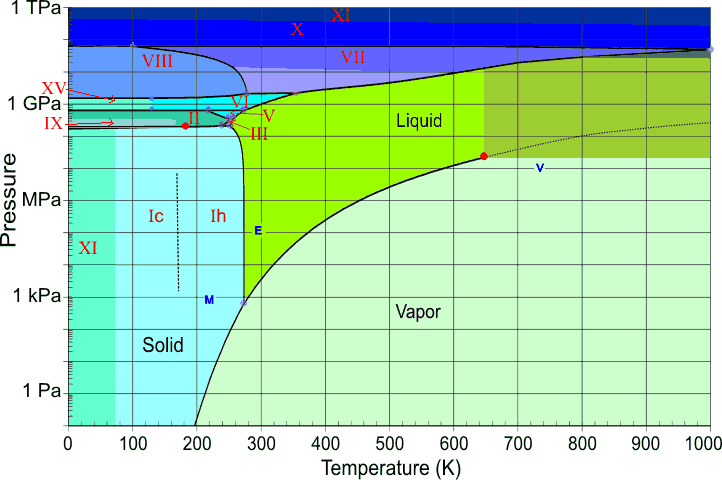
Image from Martin Chaplin's LSBU site
Martin Chaplin's LSBU site explains this diagram in great detail, and has links to separate pages that describe each of the ice phases. Another interesting page on this site deals with supercooled "glassy" states of water.