In science, there are numbers and there are "numbers". What we ordinarily think of as a "number" and will refer to here as a pure number is just that: an expression of a precise value. The first of these you ever learned were the counting numbers, or integers; later on, you were introduced to the decimal numbers, and the rational numbers, which include numbers such as 1/3 and π (pi) that cannot be expressed as exact decimal values.
The other kind of numeric quantity that we encounter in the natural sciences is a measured value of something– the length or weight of an object, the volume of a fluid, or perhaps the reading on an instrument. Although we express these values numerically, it would be a mistake to regard them as the kind of pure numbers described above.
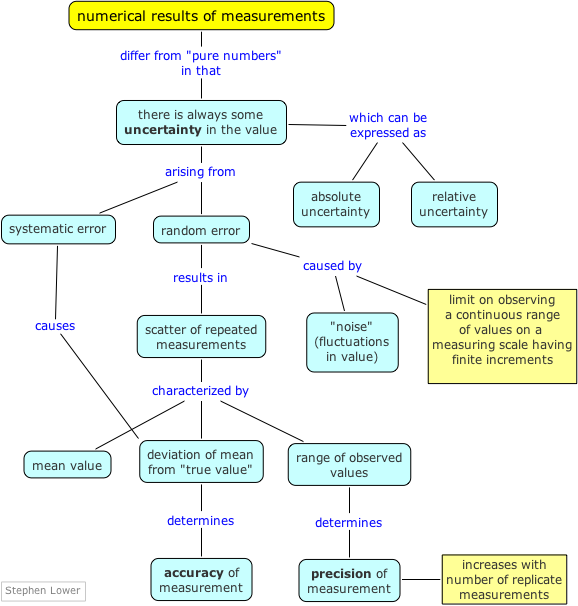
All measurements of quantities that can assume a continuous range of values (lengths, masses, volumes, etc.) consist of two parts: the reported value itself (never an exactly known number), and the uncertainty associated with the measurement.
By “error”, we do not mean just outright mistakes, such as incorrect use of an instrument or failure to read a scale properly; although such gross errors do sometimes happen, they usually yield results that are sufficiently unexpected to call attention to themselves.
Error in reading scales
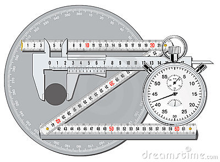
When you measure a volume or weight, you observe a reading on a scale of some kind, such as the one illustrated above. Scales, by their very nature, are limited to fixed increments of value, indicated by the division marks. The actual quantities we are measuring, in contrast, can vary continuously, so there is an inherent limitation in how finely we can discriminate between two values that fall between the marked divisions of the measuring scale.
The same problem remains if we substitute an instrument with a digital display; there will always be a point at which some value that lies between the two smallest divisions must arbitrarily toggle between two numbers on the readout display. This introduces an element of randomness into the value we observe, even if the "true" value remains unchanged.
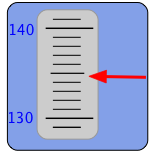
The more sensitive the measuring instrument, the less likely it is that two successive measurements of the same sample will yield identical results. In the example we discussed above, distinguishing between the values 134.8 and 134.9 may be too difficult to do in a consistent way, so two independent observers may record different values even when viewing the same reading.
Parallax error
One form of scale-reading error that often afflicts beginners in the science laboratory is failure to properly align the eye with the part of the scale you are reading. This gives rise to parallax error. Parallax refers to the change in the apparent position of an object when viewed from different points.
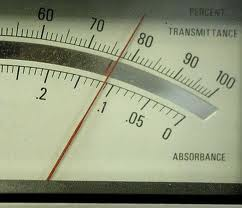
Analog-type meters, unlike those having digital readouts, are also subject to parallax error. Those intended for high-accuracy applications often have a mirrored arc along the scale in which a reflection of the pointer needle can be seen if the viewer is not properly aligned with the instrument.
Random (indeterminate) error

Systematic error
Suppose that you weigh yourself on a bathroom scale, not noticing that the dial reads “1.5 kg” even before you have placed your weight on it. Similarly, you might use an old ruler with a worn-down end to measure the length of a piece of wood. In both of these examples, all subsequent measurements, either of the same object or of different ones, will be off by a constant amount.

We tend to use these two terms interchangeably in our ordinary conversation, but in the context of scientific measurement, they have very different meanings:
Accuracy refers to how closely the measured value of a quantity corresponds to its “true” value.
Precision expresses the degree of reproducibility, or agreement between repeated measurements.
Accuracy, of course, is the goal we strive for in scientific measurements. Unfortunately, however, there is no obvious way of knowing how closely we have achieved it; the “true” value, whether it be of a well-defined quantity such as the mass of a particular object, or an average that pertains to a collection of objects, can never be known — and thus we can never recognize it if we are fortunate enough to find it.
Note carefully that when we make real measurements, there is no dart board or target that enables one to immediately judge the quality of the result. If we make only a few observations, we may be unable distinguish between any of these scenarios.
When there is no clearly defined "true" value
The "true value" of a desired measurement can be quite elusive, and may not even be definable at all. This is a very common difficulty in both the social sciences (as in opinion surveys), in medicine (evaluating the efficacy of a drug or other treatment), and in all other natural sciences.
The proper treatment of such problems is to make multiple observations of individual instances of what is being measured, and then use statistical methods to evaluate the results.
In this introductory unit on measurement, we will defer discussion of concepts such as standard deviation and confidence intervals which become essential in courses at the second-year level and beyond. We will restrict our treatment here to the elementary considerations that are likely to be needed in a typical first-year course.
How many measurements do I need?
One measurement may be enough

In the scientific laboratory, there are many contexts in which a single observation of a volume, mass, or instrument reading makes perfect sense; part of the "art" of science lies in making an informed judgement of how exact a given measurement must be. If we are measuring a directly observable quantity such as the weight of a solid or volume of a liquid, then a single measurement, carefully done and reported to a precision that is consistent with that of the measuring instrument, will usually be sufficient.
... but more are needed when there is no clearly-defined "true" value
There is often a need to determine some quantity that describes a collection of objects. For example, a pharmaceutical researcher will need to determine the time required for half of a standard dose of a certain drug to be eliminated by the body, or a manufacturer of light bulbs might want to know how many hours a certain type of light bulb will operate before it burns out. In these cases a value for any individual sample can be determined easily enough, but since no two samples (patients or light bulbs) are identical, we are compelled to repeat the same measurement on multiple objects. And naturally, we get a variety of results, usually referred to as scatter.
Even for a single object, there may be no clearly defined "true" value.
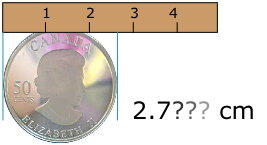 Suppose that you wish to determine the diameter of a certain type of coin. You make one measurement and record the results. If you then make a similar measurement along a different cross-section of the coin, you will likely get a different result. The same thing will happen if you make successive measurements on other coins of the same kind.
Here we are faced with two kinds of problems. First, there is the inherent limitation of the measuring device: we can never reliably measure more finely than the marked divisions on the ruler. Secondly, we cannot assume that the coin is perfectly circular; careful inspection will likely reveal some distortion resulting from a slight imperfection in the manufacturing process. In these cases, it turns out that there is no single, true value of the quantity we are trying to measure.
Mean, median, and range of a series of observations
There are a variety of ways to express the average, or central tendency of a series of measurements, with mean (more precisely, arithmetic mean) being most commonly employed. Our ordinary use of the term "average" also refers to the mean.
These concepts are usually all you need as a first step in the analysis of data you are likely to collect in a first-year chemistry laboratory course.
The mean and its meaning
In our ordinary speech, the term "average" is synonymous with "mean". In statistics, however, "average" is a more general term that can refer to median, mode, and range, as well as to mean.
When we obtain more than one result for a given measurement (either made repeatedly on a single sample, or more commonly, on different samples of the same material), the simplest procedure is to report the mean, or average value. The mean is defined mathematically as the sum of the values, divided by the number of measurements:
Range
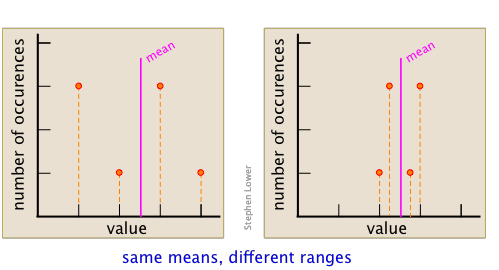
The range of a data set is the difference between its smallest and largest values. As such, its value reflects the precision of the result. For example, the following data sets have the same average, but the one having the smaller range is clearly more precise.
If you arrange the list of measured values in order of their magnitude, the median is the one that has as many values above it as below it.
Examples: for the data set [22 23 23 24 26 28] the mode would be 23.
For an odd number of values n, the median is the [(n+1)/2]th member of the set. Thus for [22 23 23 24 24 27], (n+1)/2 =3, so 23 is the median value.
Mode
This refers to the value that is observed most frequently in a series of measurements. If two or more values tie for the highest frequency, then there can be multiple modes. Mode is most useful in describing larger data sets.
Example: for the data set [22 23 23 24 26 26] the modes are 23 and 24.
The more observations, the more reliable the mean value.
If this is not immediately obvious, think about it this way. You would not want to predict the outcome of the next election on the basis of interviews with only two or three voters; you would want a sample of ten to twenty at a minimum, and if the election is an important national one, a fair sample would require hundreds to thousands of people distributed over the entire geographic area and representing a variety of socioeconomic groups.
Similarly, if you were testing the lifetimes of light bulbs, you would want to test a large number of them in order to estimate their mean lifetimes.
Statistical theory tells us that the more samples we have, the greater will be the chance that the mean of the results will correspond to the “true” value, which in this case would be the mean obtained if samples could be taken from the entire population (of people or of light bulbs.)
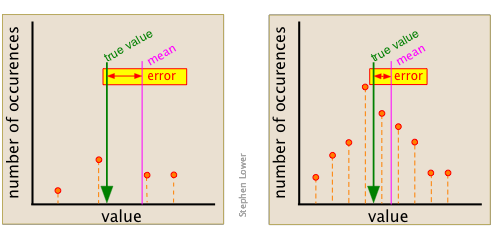
This point can be better appreciated by examining the two sets of data shown here. Each diagram summarizes the observations made The set on the right was made from of only three points (shown in orange), and gives a mean that is quite far removed from the "true" value, which is arbitrarily chosen for this example.
Plots and points
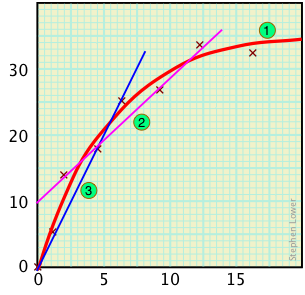
Contrast this curve with the false straight-line relationships 2 or 3 that might be obtained if only four or three points had been recorded.
If you weigh out 74.1 mg of a solid sample on a laboratory balance that is accurate to within 0.1 milligram, then the actual weight of the sample is likely to fall somewhere in the range of 74.0 to 74.2 mg; the absolute uncertainty in the weight you observe is 0.2 mg, or ±0.1 mg. If you use the same balance to weigh out 3.2914 g of another sample, the actual weight is between 3.2913 g and 3.2915 g, and the absolute uncertainty is still ±0.1 mg. Thus the absolute uncertainty is is unrelated to the magnitude of the observed value.
When expressing the uncertainty of a value given in scientific notation, the exponential part should include both the value itself and the uncertainty. An example of the proper form would be (3.19 ± 0.02) × 104 m.
Although the absolute uncertainties in these two examples are identical, we would probably consider the second measurement to be more precise because the uncertainty is a smaller fraction of the measured value. A quantity calculated in this way is known as the relative uncertainty.
Relative uncertainties are widely used to express the reliability of measurements, even those for a single observation, in which case the uncertainty is that of the measuring device. Relative uncertainties can be expressed as parts per hundred (percent), per thousand (PPT), per million, (PPM), and so on.
Propagation of Error
We are often called upon to find the value of some quantity whose determination depends on several other measured values, each of which is subject to its own sources of error.

Consider a common laboratory experiment in which you must determine the percentage of acid in a sample of vinegar by observing the volume of sodium hydroxide solution required to neutralize a given volume of the vinegar. You carry out the experiment and obtain a value. Just to be on the safe side, you repeat the procedure on another identical sample from the same bottle of vinegar. If you have actually done this in the laboratory, you will know it is highly unlikely that the second trial will yield the same result as the first. In fact, if you run a number of replicate (that is, identical in every way) determinations, you will probably obtain a scatter of results.
To understand why, consider all the individual measurements that go into each determination; the volume of the vinegar sample, your judgement of the point at which the vinegar is neutralized, and the volume of solution used to reach this point. And how accurately do you know the concentration of the sodium hydroxide solution, which was made up by dissolving a measured weight of the solid in water and then adding more water until the solution reaches some measured volume. Each of these many observations is subject to random error; because such errors are random, they can occasionally cancel out, but for most trials we will not be so lucky — hence the scatter in the results.
.
Rules for estimating errors in calculated results
Suppose you measure the mass and volume of a sample, and are required to calculate its density by dividing one quantity by the other: d = m / V. Both components of this quotient have uncertainties associated with them, and you wish to attach an uncertainty to the calculated density.
The general problem of determining the uncertainty of a calculated result turns out to be rather more complicated than you might think, and will not be treated here.
There are, however, some very simple rules that are sufficient for most practical purposes.
- 1. Addition and subtraction, both numbers have uncertainties
- The simplest method is to just add the absolute uncertainties.
Example: (6.3 ± 0.05 cm) – (2.1 ± 0.05 cm) = 4.2 ± 0.10 cm
However, this tends to over-estimate the uncertainty by assuming the worst possible case in which the error in one of the quantities is at its maximum positive value, while that of the other quantity is at its maximum minimum value. -
Statistical theory informs us that a more realistic value for the uncertainty of a sum or difference is to add the squares of each absolute uncertainty, and then take the square root of this sum. Applying this to the above values, we have
-
[(.05)2 + (.05)2]½ = 0.07, so the result is 4.2 ± 0.07 cm.
- 2. Multiplication or division, both numbers have uncertainties.
- Convert the absolute uncertainties into relative uncertainties, and add these. Or better, add their squares and take the square root of the sum.
- 3. Multiplication or division by a pure number
- Trivial case; multiply or divide the uncertainty by the pure number.