
On this page:
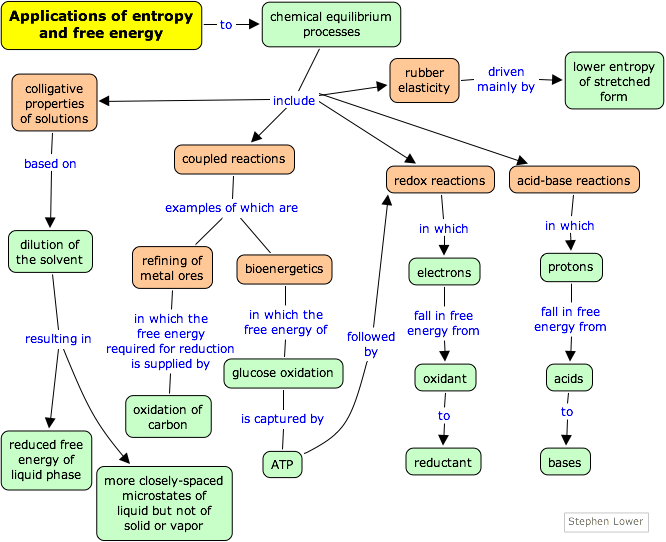
Thermodynamics may appear at first to be a rather esoteric subject, but when you think about it, almost every chemical (and biological) process is governed by changes in entropy and free energy. Examples such as those given below should help you connect these concepts with the real world.
Vapor pressure lowering, boiling point elevation, freezing point depression and osmosis are well-known phenomena that occur when a non-volatile solute such as sugar or a salt is dissolved in a volatile solvent such as water. All these effects result from “dilution” of the solvent by the added solute, and because of this commonality they are referred to as colligative properties (Lat. co ligare, connected to.) The key role of the solvent concentration is obscured by the expressions used to calculate the magnitude of these effects, in which only the solute concentration appears. The details of how to carry out these calculations and the many important applications of colligative properties are covered in the unit on solutions. Our purpose here is to offer a more complete explanation of why these phenomena occur.
The conventional explanation is that dilution of a liquid by a non-volatile solute reduces the vapor pressure or "escaping tendency" of the liquid in that phase, leading to a net transport of material into that phase. Equilibrium can then be re-established by adjusting the temperature of applying a hydrostatic pressure to the solution.
The stable phase at any temperature will be the one having the lowest free energy, and from which molecules have the smallest escaping tendency.
A more fundamental approach is to recall that dilution of a liquid creates uncountable numbers of new microstates, increasing the density of quantum states in the solution compared to that in the pure liquid. To the extent that these new states are thermally accessible, they will become populated at the expense of some of the microstates of the other phase. Equilibrium between two phases can be restored by adjusting the temperature or pressure so that equal numbers of microstates are occupied in each phase.
Boiling point elevation and freezing point depression
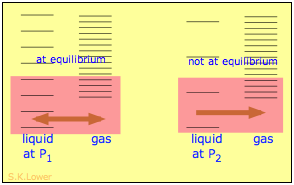
These effects are readily understood in terms of the schematic diagrams shown below. The red shading indicates the temperatures required to make equal numbers of microstates thermally accessible in the two phases.
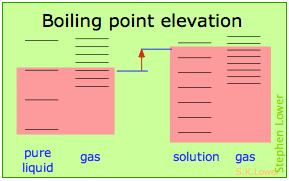
Dilution of the solvent adds new energy states to the liquid, but does not affect the vapor phase. This raises the temperature required to make equal numbers of microstates accessible in the two phases.
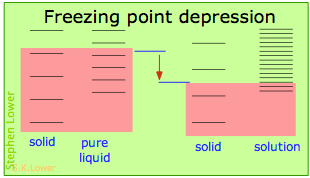 Dilution of the solvent adds new energy states to the liquid, but does not affect the solid phase. This reduces the temperature required to make equal numbers of states accessible in the two phases.
The shifts of the boiling- and and freezing points in opposite directions reflects the higher energies of vapor microstates and lower energies of solid microstates in relation to those of the liquid. Note that these diagrams are purely schematic and nowhere near to scale!
As mentioned previously, the more conventional explanation of bp elevation and fp depression is given in terms of vapor pressures. The latter are measures of the free energies of molecules in a phase, and the relationships are best understood by showing plots of –TΔS° for each phase in terms of the temperature:
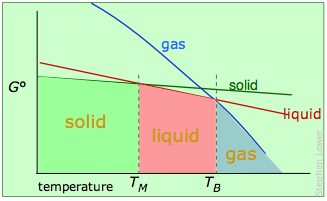 Melting and boiling points of a pure substance.
The stable phase at any temperature will be the one having the lowest free energy, and from which molecules have the smallest escaping tendency.
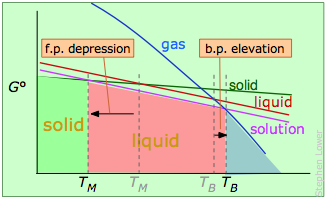 Melting- and boiling points of a solvent containing a non-volatile solute.
The solute "dilutes" the solvent, reducing its free energy (purple line) and shifting the transition temperatures in opposite directions.
The pressure on a liquid affects its volatility
When a liquid is subjected to hydrostatic pressure— for example, by an inert, non-dissolving gas that occupies the vapor space above the surface, the vapor pressure of the liquid is raised. The pressure acts to compress the liquid very slightly, effectively narrowing the potential energy well in which the individual molecules reside and thus increasing their tendency to escape from the liquid phase. (Because liquids are not very compressible, the effect is quite small; a 100-atm applied pressure will raise the vapor pressure of water at 25° C by only about 2 torr.) In terms of the entropy, we can say that the applied pressure reduces the dimensions of the "box" within which the principal translational motions of the molecules are confined within the liquid, thus reducing the density of the quantized energy states in the liquid phase.
 Why pressure affects the volatility of a liquid. Applying hydrostatic pressure to a liquid increases the spacing of its microstates, so that the number of energetically accessible states in the gas, although unchanged, is relatively greater— thus increasing the tendency of molecules to escape into the vapor phase. In terms of free energy, the higher pressure raises the free energy of the liquid, but does not affect that of the gas phase.
Osmotic flow and osmotic pressure
Molecules in a fluid are always subject to random thermal motions. If a given kind of molecule is present in greater concentration in one region of a fluid, the effect of these random motions will be to produce a net migration into the region of lower concentration; this migration is known as thermal diffusion.
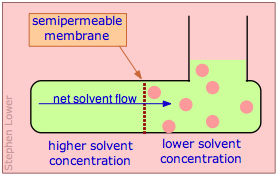 Osmotic flow (commonly known simply as osmosis) occurs when molecules of a solvent diffuse through a membrane that is permeable only to those molecules, and into a solution in which the solvent is "diluted" by the presence of solute molecules. In the simplest example, there is pure solvent on the left side of the membrane; on the other side the same solvent contains a solute whose molecules are too large to pass through the membrane. Because the solvent concentration on the right side will always be smaller than that on the left, osmotic flow will continue indefinitely if the right side can accommodate the increased volume.
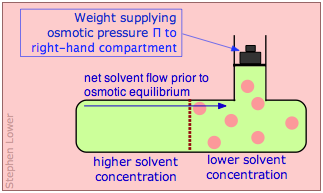 If, however, the liquid on the right side of the membrane is placed under hydrostatic pressure, the driving force for osmotic flow will diminish. If the pressure is raised sufficiently high, osmotic flow will come to a halt; the system is then said to be in osmotic equilibrium. The pressure required to bring about osmotic equilibrium (and thus to stop osmotic flow) is known as the osmotic pressure, commonly denoted by Π (Greek capital pi).
Osmotic equilibrium, like any kind of equilibrium, occurs when the free energies (that is, the escaping tendencies) of the diffusible molecules are the same on the two sides of the membrane. The free energy on the right side, initially lower due to the lower solvent concentration, is raised by the hydrostatic pressure, making it identical with that of the pure liquid on the left.
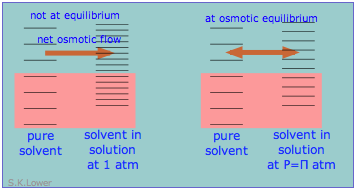 From the standpoint of microscopic energy states, the effect of the applied pressure is to slightly increase the spacing of solvent energy states on right side of the membrane so as to equalize the number of accessible states on the two sides, as shown here in a very schematic way.
 Since ancient times, the recovery of metals from their ores has been one of the most important applications of chemistry to civilization and culture. The oldest, and still the most common smelting process for oxide ores involves heating them in the presence of carbon. Originally, charcoal was used, but industrial-scale smelting uses coke, a crude form of carbon prepared by pyrolysis (heating) of coal.
Iron smelter from Catalonia [link].
The tuyere conducts air from the bellows
to supply oxygen for reactions 2 and
5 below.
See an interesting History of Metals Web page
The basic reactions are:
| MO + C → M + CO | 1 |
| MO + ½ O2 → M + ½ CO2 | 2 |
| MO + CO → M + CO2 | 3 |
Each of these can be regarded as a pair of coupled reactions in which the metal M and the carbon are effectively competing for the oxygen atom. Using reaction 1 as an example, it can be broken down into the following two parts:
| MO → M + ½ O2 | ΔG° > 0 |
4 |
| C + ½ O2 → CO | ΔG° < 0 |
5 |
At ordinary environmental temperatures, reaction 4 is always spontaneous in the reverse direction (that is why ores form in the first place!), so ΔG°(4) will be positive. ΔG°(5) is always negative, but at low temperatures it will not be sufficiently negative to drive 4.
The smelting process depends on the different ways in which the free energies of reactions like 4 and 5 vary with the temperature. This temperature dependence is almost entirely dominated by the TΔS° term in the Gibbs function, and thus by the entropy change. The latter depends mainly on Δng , the change in the number of moles of gas in the reaction. Removal of oxygen from the ore is always accompanied by a large increase in the system volume so ΔS for this step is always positive and the reaction becomes more spontaneous at higher temperatures. The temperature dependences of the reactions that take up oxygen vary, however:
reaction |
Δng |
d(ΔG°)/dT |
| C + ½ O2 → CO | .5 |
<0 |
| C + O2 → CO2 | 0 |
0 |
| CO + ½ O2 →CO2 | –.5 |
>0 |
Ellingham diagrams
A plot of the temperature dependences of the free energies of these reactions, superimposed on similar plots for the oxygen removal reactions 4 is called an Ellingham diagram. In order for a given oxide MO to be smeltable, the temperature must be high enough that reaction 4 falls below that of at least one of the oxygen-consuming reactions. The slopes of the lines on this diagram are determined by the sign of the entropy change.
Ellingham diagram An ore can be reduced by carbon only if its Gibbs free energy of formation falls below that of one of the carbon reduction reactions (blue lines.) Practical refining temperatures are generally limited to about 1500°K. |
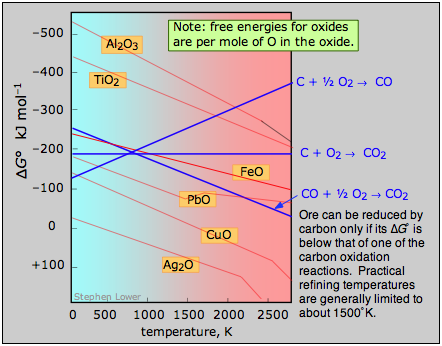 |
Examination of the Ellingham diagram shown above illustrates why the metals known to the ancients were mainly those such as copper and lead, which can be obtained by smelting at the relatively low temperatures that were obtainable by the methods available at the time in which a charcoal fire supplied both the heat and the carbon. Thus the bronze age preceded the iron age; the latter had to await the development of technology capable of producing higher temperatures, such as the blast furnace. Smelting of aluminum oxide by carbon requires temperatures too high to be practical; commercial production of aluminum is accomplished by electrolysis of the molten ore.
Many of the reactions that take place in living organisms require a source of free energy to drive them. The immediate source of this energy in heterotrophic organisms, which include animals, fungi, and most bacteria, is the sugar glucose. Oxidation of glucose to carbon dioxide and water is accompanied by a large negative free energy change
C6H12O6 + 6 O2 → 6 CO2 + 6 H2O ΔG° = – 2880 kJ mol–1 (6-1)
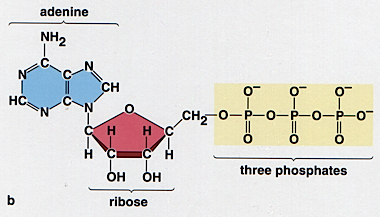
Of course it would not do to simply “burn” the glucose in the normal way; the energy change would be wasted as heat, and rather too quickly for the well-being of the organism! Effective utilization of this free energy requires a means of capturing it from the glucose and then releasing it in small amounts when and where it is needed. This is accomplished by breaking down the glucose in a series of a dozen or more steps in which the energy liberated in each stage is captured by an “energy carrier” molecule, of which the most important is adenosine diphosphate, known as ADP. At each step in the breakdown of glucose, an ADP molecule reacts with inorganic phosphate (denoted by Pi) and changes into ATP:
ADP + Pi ![]() ATP
ATP
glucose |
 |
The 30 kJ mol–1 of free energy stored in each ATP molecule is released when the molecule travels to a site where it is needed and loses one of its phosphate groups, yielding inorganic phosphate and ADP, which eventually finds its way back the site of glucose metabolism for recycling back into ATP. The complete breakdown of one molecule of glucose is coupled with the production of 38 molecules of ATP according to the overall reaction
C6H12O6 + 6 O2 + 38 Pi + 38 ADP ![]() 38 ATP + 6CO2 + 44 H2O(6-3)
38 ATP + 6CO2 + 44 H2O(6-3)
For each mole of glucose metabolized, 38 × (30 kJ) = 1140 kJ of free energy is captured as ATP, representing an energy efficiency of 1140/2880 = 0.4. That is, 40% of the free energy obtainable from the oxidation of glucose is made available to drive other metabolic processes. The rest is liberated as heat.
Where does the glucose come from? Animals obtain their glucose from their food, especially cellulose and starches that, like glucose, have the empirical formula {CH2O}. Animals obtain this food by eating plants or other animals. Ultimately, all food comes from plants, most of which are able to make their own glucose from CO2 and H2O through the process of photosynthesis. This is just the reverse of Eq 40 in which the free energy is supplied by the quanta of light absorbed by chlorophyll and other photosynthetic pigments.
 The photosynthesis-respiration free energy cycle. The zigzags represent the individual steps of energy capture by ADP and its delivery to metabolic processes by ATP.
"Thank a green plant every day."
This describes aerobic respiration, which evolved after the development of photosynthetic life on Earth began to raise the concentration of atmospheric oxygen. Oxygen is a poison to most life processes at the cellular level, and it is believed that aerobic respiration developed as a means to protect organisms from this peril. Those that did not adapt have literally “gone underground” and constitute the more primitive anaerobic bacteria.
The function of oxygen in respiration is to serve as an acceptor of the electrons that glucose loses when it undergoes oxidation. Other electron acceptors can fulfill the same function when oxygen is not available, but none yields nearly as much free energy. For example, if oxygen cannot be supplied to mammalian muscle cells as rapidly as it is needed, they switch over to an anaerobic process yielding lactic acid instead of CO2:
C6H12O6 + 2 ADP → 2 CH3CH(OH)COOH ΔG° = –218 kJ mol–1(6-4)
In this process, only (2 × 30 kJ) = 60 kJ of free energy is captured, so the efficiency is only 28% on the basis of this reaction, and it is even lower in relation to glucose. In “aerobic” exercising, one tries to maintain sufficient lung capacity and cardiac output to supply oxygen to muscle cells at a rate that promotes the aerobic pathway.
Respiration and many other metabolic processes involve electron-transfer reactions; see below for more on this.
According to the widely useful Brønsted-Lowry concept, an acid is a proton donor and a base is a proton acceptor. In 1953, Gurney showed how this idea could be made even more useful by placing acid-base conjugate pairs on a proton-free energy scale.
| In this view, acids are proton sources and bases are proton sinks. Protons fall spontaneously from acids to fill sinks in which the proton free energy levels are lower. The pH is a measure of the average proton free energy in the solution; when this quantity is the same as the proton free energy level of a conjugate pair, the two species are present in equal concentrations (this corresponds, of course to the equality of pH and pKa in the conventional theory.) |
|
The proton-free energy concept is commonly employed in aquatic environmental chemistry in which multiple acid-base systems must be dealt with on a semi-quantitative bases. It is, however, admirably adapted to any presentation of acid-base chemistry, even at the first-year college level, and it seems a shame that it never seems to have made its way into the ordinary curriculum.
The Competing for the Proton page presents this idea in more detail in the context of acid-base reactions.
A nice overview and a more complete diagram can be seen on this Web page.
Oxidation-reduction reactions proceed in a direction that allows the electron to “fall” (in free energy) from a “source” to a “sink”. Later on when you study electrochemistry you will see how this free energy can manifest itself as an electrical voltage and be extracted from the system as electrical work. (See here for a preview.)
Electron-free energy levels and the electromotive series
You may already have seen an electromotive force table that shows the relative tendencies of different reducing agents to donate electrons. The same information can be presented in another way that relates electron-donating (reducing) power to the "fall" in free energy that electrons undergo when they are transferred to an oxidizing agent.
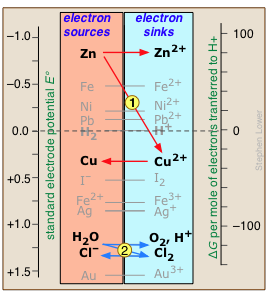 Any available sink on the right side will tend to drain electrons from a source above it. For example, immersion of metallic zinc in a solution of CuSO4 allow electrons to "fall"
 ![]() from the high free energy they possess in Zn down to the lower free energy level in the newly-introduced Cu2+ ions. This will result in the reduction of Cu2+ to metallic copper and the oxidation of the zinc (red arrows.)
from the high free energy they possess in Zn down to the lower free energy level in the newly-introduced Cu2+ ions. This will result in the reduction of Cu2+ to metallic copper and the oxidation of the zinc (red arrows.)
Similarly, addition of chlorine to water will introduce a new electron sink (Cl2) that lies below the free energy of the accessible electrons in H2O, draining them away ![]() and producing O2 and Cl– (blue arrows.) Note especially the positions of the H2/ H+ and H2O/O2,H+ couples on this chart, as they define the range of E°s for substances that will not decompose water.
and producing O2 and Cl– (blue arrows.) Note especially the positions of the H2/ H+ and H2O/O2,H+ couples on this chart, as they define the range of E°s for substances that will not decompose water.
The zero for G° is arbitrarily set at the electron activity at which the H2/H+ couple is at equilibrium; this corresponds to E° = 0 volts on the ordinary electromotive scale.
A more detailed explanation of this kind of diagram can be found on this electrochemistry page; see here for a more complete view of the electromotive series in this format.
Coupled redox reactions are central to bioenergetics
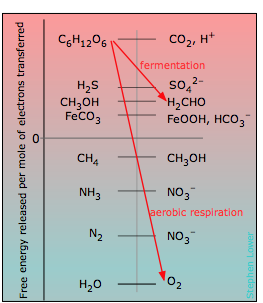 In organisms, the free energy is captured in a series of coupled reactions as described above, and eventually made available for the various free energy-consuming processes associated with life processes. At its simplest level, the respiratory process can be regarded as the removal of electrons from (oxidation) of carbohydrate {CH2O} to some lower-free energy acceptor. As shown in the Figure, numerous electron acceptors can serve this function, but none yields nearly as much free energy as aerobic respiration whose net reaction is
{CH2O} → CO2 + H2O(6-5)
In the above chart, the zero for G° is arbitrarily set at the electron free energy required to maintain the H2/H+ couple is at equilibrium; this corresponds to E° = 0 volts on the ordinary electromotive scale.
Organisms that live in environments where oxygen is lacking, such as marshes, muddy soils, and the intestinal tracts of animals, must utilize other electron acceptors to extract free energy from carbohydrate. A wide variety of inorganic ions such as sulfate and nitrate, as well as other carbon compounds can serve as electron acceptors, yielding the gaseous products like H2S, NH3 and CH4 which are commonly noticed in such locations. From the location of these acceptors on the scale, it is apparent that the amount of energy they can extract from a given quantity of carbohydrate is much less than for O2. One reason that aerobic organisms have dominated the earth is believed to be the much greater energy-efficiency of oxygen as an electron acceptor.
What did organisms use for food before there was a widespread supply of carbohydrate in the world? Any of the electron sources near the upper left of the table can in theory serve this function, although at reduced energy efficiency. As a matter of fact, there are still a number of these autotrophic bacteria around whose “food” is CH4 , CH3OH, FeCO3, and even H2!

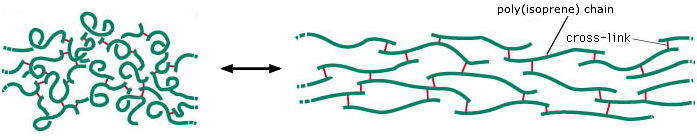
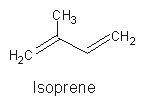 Rubber is composed of random-length chains of polymerized isoprene molecules. The poly(isoprene) chains are held together partly by weak intermolecular forces, but are joined at irregular intervals by covalent disulfide bonds so as to form a network. The intermolecular forces between the chain fragments tend to curl them up, but application of a tensile force can cause them to elongate. The disulfide cross-links prevent the chains from slipping apart from one another, thus maintaining the physical integrity of the material. Without this cross-linking, the polymer chains would behave more like a pile of spaghetti.
This image is adapted from one intended to show the structure
of the rubber-like protein elastin,
which is found in many organisms, including humans.
The ability of rubber bands and other elastic substances to undergo a change in physical dimensions in response to a change in the applied stretching force is subject to the same laws of thermodynamics as any other physical process. You can investigate this for yourself:
Hold a rubber band (the thicker the better) against your upper lip, and notice how the temperature changes when the band is stretched, and then again when it is allowed to contract.
a) Use the results of this observation to determine the signs of ΔH, ΔG and ΔS for the process
rubberstretched → rubberunstretched
b) How will the tendency of the stretched rubber to contract be changed if the temperature is raised?
Solution:
a) Contraction is obviously a spontaneous process, so ΔG is negative.
You will have observed that heat is given off when the band is stretched, meaning that contraction is endothermic, so ΔH > 0. Thus according to ΔG = ΔH – TΔS, ΔS for the contraction process must be positive.
b) Because ΔS > 0, contraction of the rubber becomes more spontaneous as the temperature is raised.
Why is rubber elastic?
When an ordinary material is placed under tension, the strain energy is taken up by bond distortions and is stored as electrostatic potential energy which rises very rapidly so as to greatly inhibit further elongation. In rubber-like polymers, this does not happen; the strain energy is instead stored as thermal (kinetic) energy.
Free polymer chains naturally tend to curl up in complex and ever-changing ways as thermal energy allows random bond rotations to take place. In a rubber-like material in its relaxed state, the portions of the polymer chains between cross-links are continually jumping between different randomly-coiled configurations.
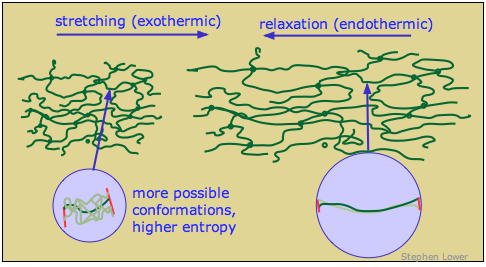
When the rubber is stretched, the polymer segments straighten out as the applied force overcomes the weak dispersion force interactions that caused the strands to curl. Each chain segment is pulled into an almost-straight conformation, thus greatly reducing the quantity of thermal energy it can store. The excess thermal energy spreads into the material and is lost in the form of heat. When the rubber relaxes, the polymer strands curl up again and soak up thermal energy.
The spontaneous contraction of rubber is largely an entropy-driven process. The number of energetically-equivalent ways of distributing thermal energy amongst the nearly-linear polymer chains of the stretched state of rubber is insignificant compared to those available when the chains are curled up in random ways, so the un-stretched form of rubber is statistically the most likely one by overwhelming odds.
As noted in part (b) of the above problem example, the gain in entropy when the rubber contracts drives ΔG more negative at higher temperatures. This means that a rubber band, held at constant tension in stretched state, will contract when it is heated.
 This fact can be put to use in an interesting way. Replace the spokes of a bicycle wheel with rubber bands, and shine a heat lamp on one side of the wheel. The contraction of the heated bands will shift the wheel off-center, causing it to rotate. This rotation will continue indefinitely as long as the heat source is present. The device has become a heat engine whose working "fluid" is rubber!
 This recalls the classic perpetual motion machine design in which a wheel is caused to rotate by continually-shifting unbalanced weights. (The one depicted here uses hinged vials of mercury.) That, as we saw, would violate the Second Law by producing work in a cyclic process without degrading heat to a lower temperature. The rubber-band heat engine avoids this pitfall by absorbing heat from an external source on one side of the wheel, and releasing it at a lower temperature on the unheated side.
(You are expected to be able to define and explain the significance of terms identified in green type.)
- What do all of the colligative properties of solutions have in common in terms of entropy?
- At the melting and boiling points, the two phases in equilibrium have equal numbers of energetically accessible microstates. How does the addition of a nonvolatile solute upset this balance in the two cases?
- Describe the effect of increasing the hydrostatic pressure on a liquid has on its vapor pressure, and suggest a reason for this.
- Under what conditions does osmotic flow occur? What is the fundamental driving force? What is the definition of osmotic pressure?
- Explain the critical role of temperature in the extraction of metals from their oxide ores.
- Describe the bioenergetic cycle of free energy in terms of the roles of glucose, electron-acceptors, ATP, and photosynthesis.
- Define aerobic and non-aerobic oxidation, and explain why they differ in efficiency.
- Sketch a simple proton-free energy diagram showing why an acid reacts with a base.
- Sketch a simple electron-free energy diagram showing why a metal reacts with an oxidizing agent that is below it in the electromotive series.
- What thermodynamic factors are involved in the spontaneous contraction of an elastic material such as a rubber band?

Page last modified: 09.08.2018
© 2003, 2007 by Stephen Lower - Simon Fraser University - Burnaby/Vancouver Canada
 © 2003, 2007 by Stephen Lower - Simon Fraser University - Burnaby/Vancouver Canada
 For information about this Web site or to contact the author,
please see the Chem1 Virtual Textbook home page.

This work is licensed under a
Creative Commons Attribution-Share Alike 3.0 License.